

Market basket analysis reports reveals your next growth opportunity which is resides in past order patterns. Sellers, typically, and to chase traffic, rankings, and ad scale.
However, once you look into the market basket data, it reveals that customers are quietly telling a different story through how they shop. When someone buys multiple products in one cart, they’re not simply purchasing items but building a solution or an experience.
Sometimes that this routine buyer behavior can signal unprecedented opportunity for you. Those combinations are behavioral signals, and they’re far more honest than surveys or reviews.
This is where Amazon market basket analysis becomes powerful. It shows what customers actually consider related, useful, or necessary together. Once you see those patterns, everything changes. Bundles stop being guesses.
A+ content becomes solution-focused. Most importantly, you know exactly what products to target with your product attributed targeting ads. Ultimately, Sponsored Brand ads turn into visual “systems,” not random products.
Moreover, your catalog evolves into an ecosystem designed around how people naturally buy.
Instead of pushing isolated listings, you start aligning with customer behavior, being more focused on increasing average order value, improving ad efficiency, strengthening cross-sells, and supporting repeat purchases. That shift from product selling to solution selling is the thread connecting everything we’ve covered in this article.
Quick Guide
What is Market Basket Analysis?
Market Basket Analysis is a data backed technique that helps to identify products that are frequently purchased together in a single order.
Diving a little deeper into what it studies, it analyzes shopping cart patterns to decode product relationships of your market basket data.
Let’s say every time a customer places an order, they create a “basket” of items. When Amazon’s Apriori algorithm analyzes this data at scale, patterns begin to emerge out of customer behavior.
To find the report, you can head over to the Menu section of Seller Central dashboard, click on Brands and choose Brand Analytics.
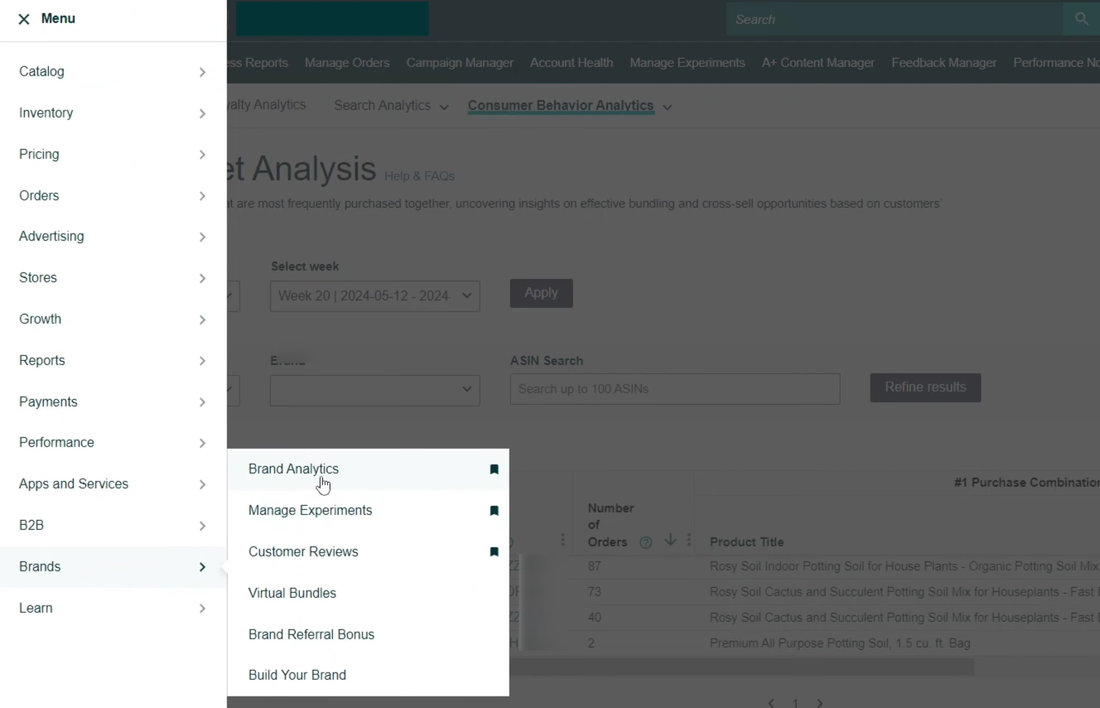
Then hover over Consumer Behavior Analytics to find the option to view Market Basket Analysis option.
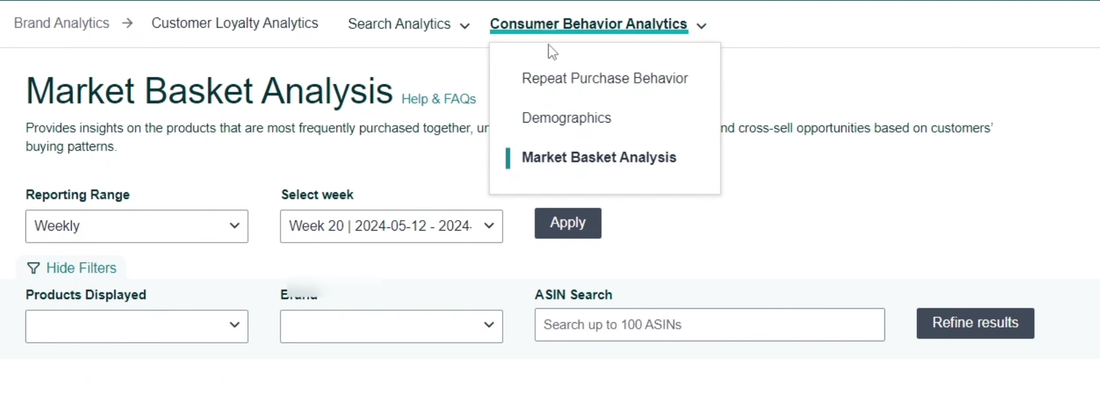
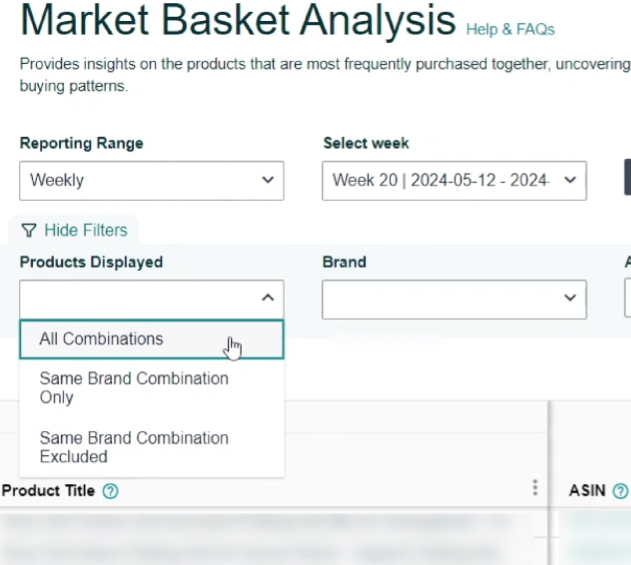
From here you can choose weekly, monthly or quarterly reporting period view, select the range and product combination (here you can include or exclude same brand combination), choose brand, category and generate the Market basket analysis report.
At its core, market basket analysis shows you if a customer buys Product A, what else are they likely to buy?
- For example, a very widely noted pattern is customers buying a phone often add a screen protector or charging cable or adapter to their purchase.
- Another common pattern can be people purchasing baby diapers along with baby wipes within a single order.
A market basket analysis report also shows:
- How strong those product relationships are
- Which combinations create higher order values.
For Amazon sellers, an Amazon market basket analysis report displays the top three Purchase Combinations products customers most frequently purchase with a certain ASIN that you offer, based on patterns in aggregate purchasing data from Amazon.
These can be your own products or those belonging to a competitor.
From a documentation standpoint, businesses often formalize this work through a market basket analysis project report, which outlines:
- The dataset used (orders, SKUs, transaction history)
- Key product combinations identified
- Revenue opportunities from bundling or cross-selling
- Business recommendations based on findings
Note: The Amazon market basket analysis report is available exclusively to sellers enrolled in Amazon Brand Registry.
We will share how you can use these insights for increasing overall profit in the following section.
How does Market Basket Analysis report work for Amazon sellers?
We’ve already discussed that the Amazon Market Basket Analysis report analyzes the actual customer purchase behavior across Amazon to identify which products are bought together in the same transaction.
For each of your products (ASINs), it shows product ASIN, product title, percentage of orders, using which you can filter results to either include or exclude products from other brands, allowing you to see both cross-brand purchasing patterns and purchases within your own product line.
For an estimation, a percentage above 10% or higher indicates a truly popular basket companion, while smaller percentages like 1% may represent random purchases.
Let’s say you sell workout gears. When you open the Amazon Market Basket Analysis report for your yoga mat, you’ll come accross something like this:
- Pilates socks: 15% of orders
- Resistance bands: 12% of orders
- Sipper bottle: 8% of orders.
This translates to, out of every 100 people who bought your yoga mat, 15 also bought pilates socks in that same order, 12 bought resistance bands, and 8 bought a sipper bottle.
This way you understand, you can find new product opportunities and much more that we’ve mentioned in the following sections.
How? Say you dont sell pilates socks, but reports tell you 15 out of 100 customers also bought pilates socks, then from this you can derive that you should sell the socks too.
You can also get an idea of what to include in bundle deals. Say you sell resistance bands and sipper bottles at the moment, you still can create a successful bundle deal with a yoga mat, resistance bands, and sipper bottles.
In addition, you can advertise smarter. How? Instead of randomly advertising your sipper bottles everywhere, you could place ads on the product page of yoga mats, since a part of those customers clearly want yoga mats too.
Practical Applications of Market Basket Analysis Reports
Most sellers understand market basket analysis at a surface level.
You ask them, and they know customers who are regular buyers of their coffee will also buy filter papers, whether from their own brand or others, market basket analysis reports make it clear.
But when you properly interpret market basket data and document insights in a structured manner, it becomes an operational strategy determinant.
Here are some use cases on how it looks when put into practice.
Test Bundle Performance Before Retail Expansion
When two or more products appear together in orders more frequently than random chance, it signals customer-perceived complementarity; customers see them as part of the same solution or experience.
Here, bundling works not because of discounts, but because it removes friction. Customers don’t want to look for what else they might need. Once the common requirements come in a bundle, one “Add to Cart” and they’re done.
That’s why sellers use Amazon Market Basket Analysis report as a low-risk testing ground before committing to retail bundles. Based on Market Basket Analysis data considering combinations with 10%+ co-purchase rates they launch 3–5 bundle variations and monitor performance for 30–60 days.
By comparing bundle sales vs. individual product sales and tracking repeat purchases, they identify potential winners.
For example, if a brand generating $10,000 in monthly shampoo sales launches a shampoo + conditioner bundle and bundle revenue rises to $20,000 the following month, that 100% lift indicates customers prefer the complete solution and validates strong product affinity that market basket research predicted.
This data-backed validation reduces risk, prevents excess retail inventory, and provides proof of demand when pitching retailers, turning bundling from a speculative move into a measured scale strategy.
In this way, you are converting existing buying behavior into a structured offer, increasing Average Order Value (AOV), conversion rate, and product ecosystem lock-in.
Using Market Basket Analysis Reports to Power Your Amazon PPC Campaigns
Here’s how successful sellers transform their advertising strategy using product combination insights.
Protect Your Territory with Self-Targeting (Brand Looping)
When customers land on your product page, competitor ads often appear below your Buy Box, stealing sales you’ve already earned.
You can leverage, Market Basket Analysis reports to identify which of your products are frequently bought together, and then advertise them under your other ASINs.
This defensive approach will help you’ll prevent them to display their products and poach away your potential sales. Let’s say you sell matcha, and your Market Basket Analysis report shows that 12% of matcha buyers also purchase Brand X’s whisk.
So, create a Sponsored Display campaign, choose “Product Targeting” as your targeting type, and launch the campaign around your product displayed under your product page.
So, when someone views your matcha powder, they now see your whisk ad below the Buy Box, exactly where a competitor’s ad would normally appear.
This way you’re intentionally “boxing out” competitors while cross-selling your own products through Brand Looping.
Create Irresistible Visual Bundles with Side-by-Side Display Ads
While individual product ads are effective, showing multiple complementary products together creates a powerful “complete solution” effect that dramatically increases click-through rates.
Market Basket Analysis reports reveal that customers frequently buy resistance bands (your bestseller), yoga mats (15% combination), and foam rollers (10% combination) together. Instead of advertising these separately, create a Sponsored Brands campaign, feature all three products in a single ad unit. Then target broader search terms like “yoga equipment” or “home workout gear” and link the ad to a custom Store page showcasing your complete fitness collection.
This helps customers visualize a complete workout setup rather than individual items. This then becomes a “solution selling” approach that converts better because you’re solving their entire problem while also introducing them to your entire collection of SKUs.
Be Visible to Competitors’ Customers via PAT Ads
Your Market Basket data also reveals what customers buy from competitors alongside your items. Once you set your Market Basket report to “All Products” view, you discover that 11% of customers who buy your water filter also purchase a competitor brand’s replacement cartridges.
As you look further, this tells you that the particular competitor doesn’t offer their own filter, or their customers prefer yours.
To make the most out of the situation, you can create a Sponsored Products campaign, target that brand’s cartridge product page specifically to advertise your complete system of filter + your branded cartridges.
You can also use aggressive bidding, as these customers have high purchase intent. If your budget permits, you can also run defensive campaigns targeting your own ASINs to prevent competitors from using this exact strategy against you.
Identify White Space Opportunities using Market Basket Analysis Report
Market Basket Analysis report also lets you find gaps in your product line by seeing what customers buy from competitors. How? Let us explain.
Once you open up your Amazon market basket analysis report and set the filter to “All Products”, you’ll find competitor products with 10%+ combination rates.
Now your responsibility is to evaluate the feasibility of incorporating similar items into your own product catalog. Of course, consider margin potential and prioritize based on the combination percentage.
Market Basket Analysis Reports to Eliminate Underperforming SKUs
Market Basket Analysis project reports can also be used to identify which of your products have low cross-purchase rates, indicating weak product-market fit.
When you change the filter to “My Products Only” and review all your ASINs and flag products with consistently low (<3%) combination rates, you identify the underperforming items.
On top of that, once you cross-reference with overall sales velocity, you’ll be sure of products that are better discontinued. If you do not want to continue, you can always pause and reposition these weak performers.
Here’s a decision framework for you.
- Product with <3% combination rate + low sales = candidate for elimination.
- Product with <3% combination rate + high sales = performs better as a standalone winner.
- Product with >10% combination rate + low sales = performs better with bundles.
Market Basket Analysis for A+ Content
There’s a way to use A+ Content to showcase products that Market Basket data indicates are purchased together. Most sellers treat A+ Content as branding space, so insight derived from the report will give you a blueprint for how your product pages should be structured.
A+ Content sits mid-page, where customers evaluate whether a product fits their needs. At this stage, they are highly receptive to add-on suggestions, use-case expansion, and it is a good scope to explain what else will serve them to get the best experience of the product itself.
So, you can use market basket research to control the narrative.
Identify top 3 companion products from Market Basket data. Create a comparison chart module showing all products side-by-side and include lifestyle images showing products used together. It can also be a successful way of cross selling your products.
Optimize Listings using Product Titles & Bullet Points
This strategy is simple. You refer to the competitor ASINs and use SellerApp’s Reverse ASIN tool to find all the essential keywords they are using as a part of the Listing optimization.
Market Basket Analysis enables you to quickly narrow down your competitor list.
If you’re willing to go even further to capture broader search intent, note which products commonly purchased together, and add complementary product keywords to titles/bullets. Remember to mention and highlight compatibility or use cases with companion items.
For example, if you’re selling 12-Cup Programmable Coffee Maker, you can write it as “12-Cup Programmable Coffee Maker, Compatible with Standard Coffee Filters and Thermal Carafes” where coffee filters and thermal carafes are the keywords from compatible items.
Ensure Repeat Purchases Using Market Basket Analysis Project Report
One of the most overlooked applications of market basket analysis report has to be its ability to drive repeat purchases. If not through ads, but through post-purchase strategies that won’t cost you much.
Market basket data often reveals a sequence, like, customers buys your Product A first, then come back later for Product B maybe because the initial purchase lived up to their expectations. This buying pattern, typically documented in an Amazon market basket analysis report, creates a powerful retention opportunity where you guide their next purchase based on data. The two work best together, not in isolation.
Here’s how.
On Amazon, a sports nutrition brand with SKUs such as 1kg Whey Protein, a Shaker Bottle, and a 2kg Value Pack discovered through its Repeat Purchase Report that nearly half of 1kg buyers returned within 30–45 days. Aligning with the natural replenishment cycle, Market Basket Analysis report revealed that 52% of repeat 1kg buyers also purchased a Shaker Bottle and shaker buyers were nearly twice as likely to upgrade to the 2kg pack later. Instead of generic brand bidding, the company launched a Sponsored Products campaign targeting its own 1kg protein powder ASIN, bidding aggressively for product-page placements. When returning buyers came back to reorder, they found the shaker ad and thats how they effectively increased sales for the shaker and overall increased the repeat order rates and securing an opportunity for future pack-size upgrades in sales.
If you follow this excellent strategy, you can successfully scross sell your products and simultaneoulsy upsell the products that you already sell. This is what we call making the most out of the resources in hand!
Promoting Subscribe & Save
Offer Subscribe & Save for product combinations that show high repeat purchase correlation.
First, filter Market Basket to consumable products, cross-reference with Repeat Purchase Behavior report then identify products bought together repeatedly.
Create an S&S option for the bundle and price it at 10-15% discount for subscription. If you sell pet supplies, you find dog food and dog treats show 18% combination rate. You find the fact that both shows 65% repeat purchase rate monthly, cross referencing the Amazon Repeat Purchase Behavior data.
So, you create a S&S bundle at 12% discount. As a result, you find a stable recurring sale funnel.
Storefront Optimization using Market Basket Analysis Report
Most Brand Stores on Amazon are structured by product type, but the Market Basket Analysis Report shows customers think in solutions, not categories.
By analyzing market basket data, sellers can group items into use-case collections based on real co-purchase behavior, highlighted in reports.
Instead of “Pots” or “Utensils,” a kitchen brand might create “Complete Cookware Set” or “Baking Essentials,” reflecting how shoppers actually buy, thinking of solving real life usage.
The order is determined by highest combination rates, ensuring the most selling associate products get the most visibility for as a part of strong product clusters. This structure improves navigation, cross-sell rates, and overall Average Order Value.
Sponsored Brands Store Spotlight
This strategy connects advertising with store design using insights from an Amazon market basket analysis report.
For this strategy, sellers refer to the Amazon market basket analysis report to create themed Store pages built around high-affinity product clusters. Sponsored Brands ads then display complementary products side-by-side and link directly to that curated page, not the homepage.
For example, when a user searches for “home office desk accessories”, it leads to an ad featuring a desk organizer, lamp, and mouse pad as these are the products proven through market basket data as items purchased together.
The landing page reinforces bundles, comparison charts, and solution messaging, increasing multi-item purchases and improving overall ad efficiency.
Holiday Bundle Planning with Market Basket Analysis
Seasonal demand reshapes buying behavior, and market basket analysis helps sellers capture those shifts early. By comparing market basket data from Q4 against Q1–Q3, sellers can spot temporary co-purchase spikes that signal gift-oriented buying.
For instance, a coffee maker and filters may show a steady 10% pairing normally, but in Q4, a coffee sampler joins the basket, pushing the combination to 22%. That insight supports creating a limited-time holiday bundle.
Launching this bundle 6–8 weeks before peak season and using scarcity messaging like “Holiday Bundle” or “Limited edition” or even turning it into an advent calendar for premium products work wonders for leveraging seasonal spikes in sales.
Trend Prediction Using Market Basket Analysis Report
Beyond current sales, Market basket analysis project report can reveal where demand is heading. By reviewing market basket data monthly, sellers can detect new product categories increasingly appearing alongside their items.
For example, laptop stands moving from 5% to 12% co-purchase with office supplies signals a sustained behavior shift rather than a random spike.
This pattern suggests a bigger change in trend, like remote work being more popularized. This approach ensures expansion decisions are guided by real customer behavior, not assumptions. These insights often come handy during new product development before competitors acquire the market.
Customer Profile Development Using Market Basket Analysis Report
Strong branding starts with knowing who your customer really is, and market basket analysis report reveals this.
By examining market basket data, sellers see which products consistently appear together, allowing them to infer lifestyle patterns and needs.
If yoga mat buyers also purchase meditation cushions, essential oils, and wellness journals, the data signals a customer focused on holistic well-being.
Sellers can build personas around these patterns, shape messaging, visuals, and product storytelling accordingly, and validate assumptions with demographic insights.
This ensures brand positioning reflects real buyer identity, improving resonance, loyalty, and long-term customer value. On top of that, it aids in product and brand positioning, which often can lead your brand into becoming a category leader for future product launches and achieve an overall better product market fit.
Premium vs. Budget Line Strategy with Market Basket Data
Pricing strategy becomes clearer when guided by market basket research. By filtering market basket data by price tiers, sellers can see whether customers mix premium and budget items or stay within the same range.
If premium mats pair mostly with premium accessories and budget products pair together, the data shows customers perceive value tiers distinctly.
In this case, brands should maintain clear segmentation rather than blending price levels. If cross-tier mixing were high, mixed bundles would make sense.
This evidence-based approach protects brand positioning, supports margin strategy, and aligns offers with how customers actually evaluate value.
Final Thoughts
Market Basket Analysis report is a shift in how you think about your business strategies, based on previous purchase patterns.
Instead of viewing products as individual SKUs competing for attention, you begin to see them as parts of customer “solutions.” That perspective changes everything including how you design bundles, structure your Store, run ads, write listings, plan inventory, and even decide what to launch next.
The sellers who grow fastest on Amazon are increasing the value of every customer who already clicks. That happens when your strategy aligns with real buying behavior, not assumptions. Because your customers have already told you what belongs together.
Amazon Market Basket Analysis report is simply how you learn to listen and turn those insights into predictable growth.
The fact is where you access that data determines how seamlessly it works for you.
Amazon’s native Amazon Market Basket Analysis report may give you a starting point but SellerApp’s Business Reports take it significantly further.
While Amazon shows you co-purchase patterns at a surface level, SellerApp’s version maps market basket information directly to specific ASINs, and goes a step further by layering in Share of Voice and Share of Shelf, giving you competitive context that Amazon’s report simply doesn’t offer. For sellers who need this depth, SellerApp offers this as a custom solution tailored to your specific business needs.
Beyond the Market Basket research data, SellerApp’s broader reporting suite is built around the core concept of making data easier to act on. Everything is recordedin a unified dashboard, so instead of flipping between tabs and reconciling numbers from different sources, your entire decision-making view is in one place. Reports are dynamic and update every 7 days, meaning no repetitive downloads for team members or stale data guiding your strategy. Also when it’s time to align your team or walk stakeholders through findings, you can share a live URL directly making collaboration and presentations easy without exporting a single file.
If you’re interested in the custom Market Basket report the next step is a quick call with the SellerApp team to scope it around your business goals. Schedule a call now.