BUY BOX REPORT
Find out how your business stacks up to the competition.
48%
Track your Buy Box percentage share.
61%
Increase in revenue by ensuring Buy Box win during peak hours.
10x
More profits by taking control over your landing price.
Here's What to Expect

Brand Analysis
Get your Buy Box share percentage. Lost Buy Box? Find out to whom and at what price.

Price Evaluation
Analyze the factors affecting Buy Box. Evaluate your shipping and pricing strategies.

Increased Profit Margin
Optimize your prices at the right time and increase your profit margin.
Objective
What are you going to infer from this report?
Transform Complexities into Opportunities
Pinpoint product gaps and pricing opportunities. Compare them with multiple brands. Turn glitches into opportunities to win the Buy Box.
Optimize and Increase Your Buy Box Sessions
Find out the percentage of shipping and pricing above the Buy Box winner. Optimize your product performance to increase your Buy Box percentage share.
Scope
We analyze the following parameters in the report.
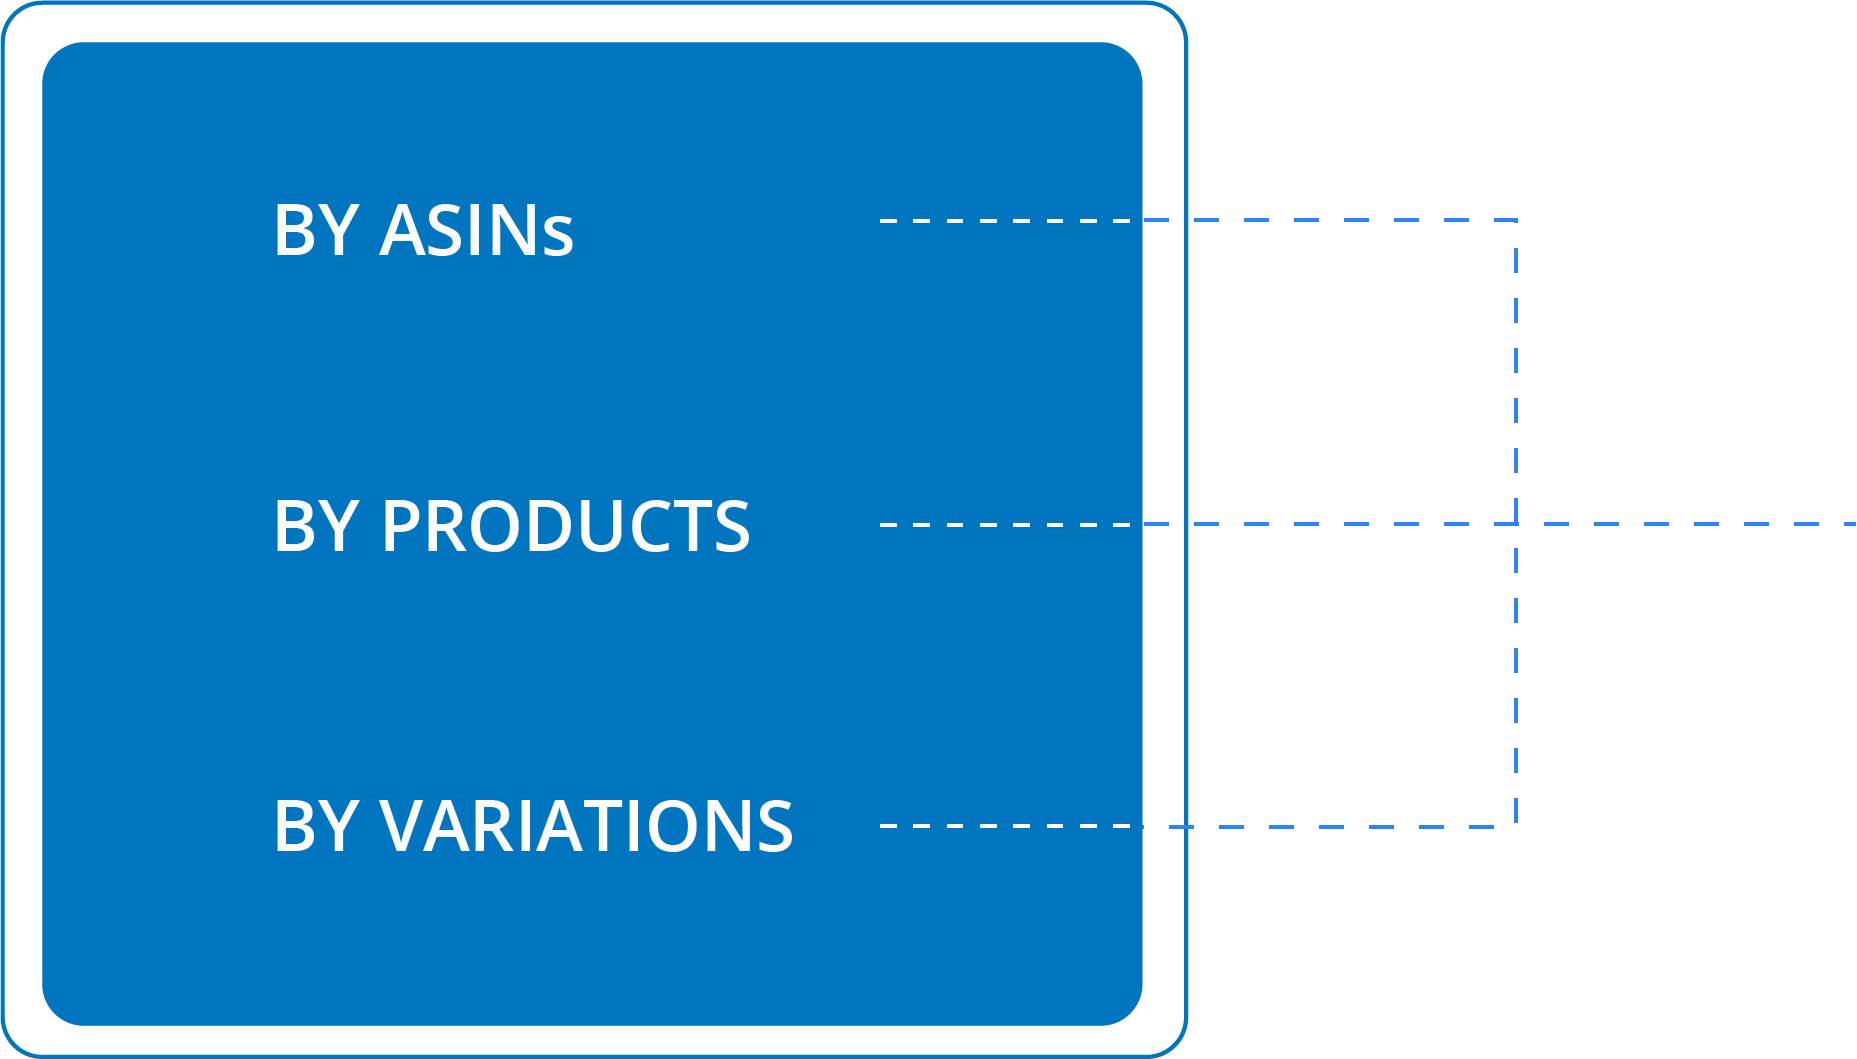
1.Buy Box Price
2.Buy Box Winner
3.Price Above Buy Box Winner (%)
4.Shipping Above Buy Box Winner
5.Total Buy Box Price (Shipping + Price)
6.Sales Potential
Who Uses SellerApp’s Buy Box Report?
Brand and E-commerce Heads
Agencies
Sales and Marketing

Brand and E-commerce Heads
- Assess what your brands are up to.
- Streamline your operations based on pricing analysis.
Leading companies love SellerApp


It's time to rack up your profit margins!
Let’s see if we can customize the report based on your business needs.
"Using SellerApp’s margin calculator module, Quantum Networks was able to assess the pricing information of various brands. This increased the efficiency of on boarding and streamlining new products."
Eytan Wiener, COO and Co-Founder