

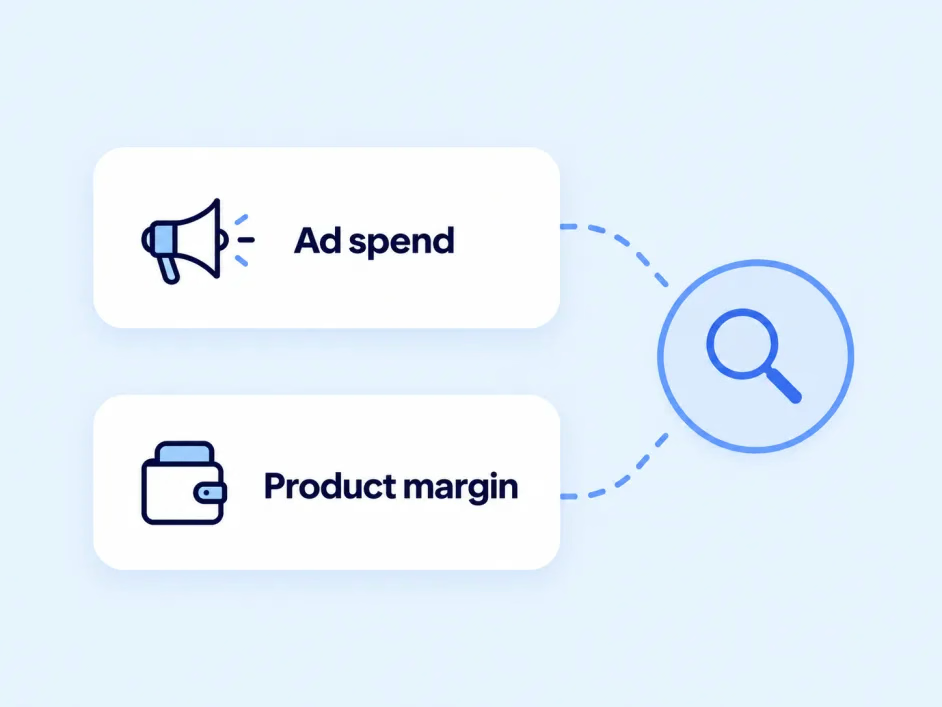
Review before scaling
Look at advertising costs alongside product profit before increasing spend.
See product profitability, advertising costs, refunds, and inventory together, so your next growth decision starts with the full picture.
Demonstration with sample data. A 30-day Amazon.com account overview shows $72,790 in sales, 16.1% TACOS and 3.8% of sales refunded. Selecting the Blue Water Bottle shows $18,720 in sales, with Amazon fees, storage, advertising, refunds and cost of goods leaving $380 net profit, a 2.0% margin. Advertising is 25.0% of its sales and its refund rate is 6.9%, so both are worth reviewing before scaling.
Illustrative product preview.
Trusted by marketplace teams at






See which products make money after costs, so you can focus on the right opportunities.
SellerApp brings in sales data from your connected Amazon account.
Fees, advertising, and refunds affect what remains.
What you pay to make or buy each unit is its cost of goods sold, or COGS.
With product costs included, you get a clearer view of your profit.
SellerApp brings in sales data from your connected Amazon account.
Fees, advertising, and refunds affect what remains.
What you pay to make or buy each unit is its cost of goods sold, or COGS.
With product costs included, you get a clearer view of your profit.
Understand the signals behind your next decision.
Look at advertising costs alongside product profit before increasing spend.
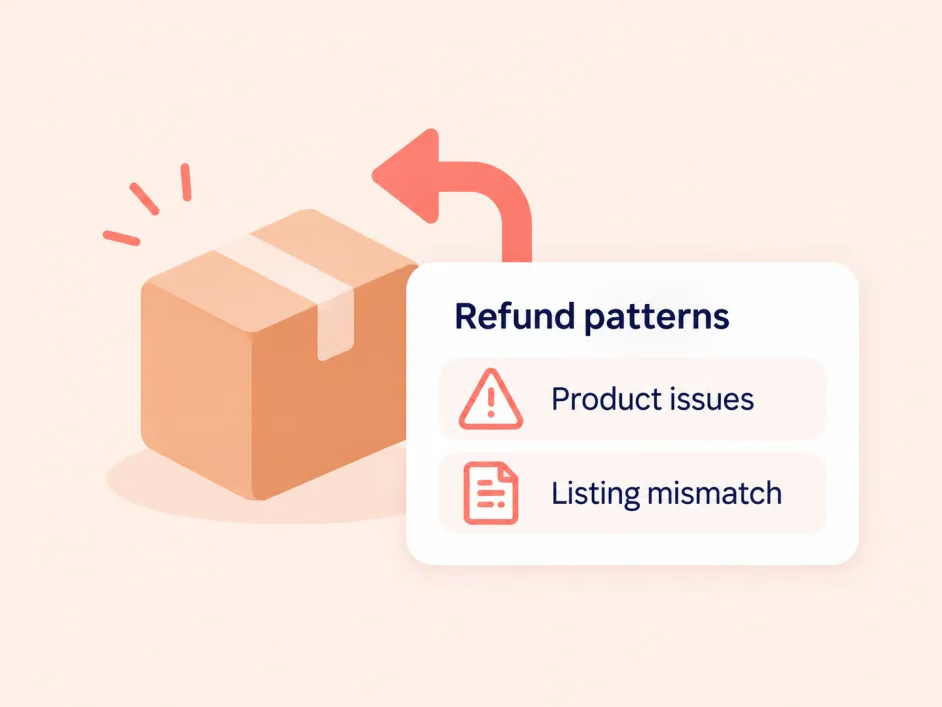
See which costs and refund patterns need a closer look.
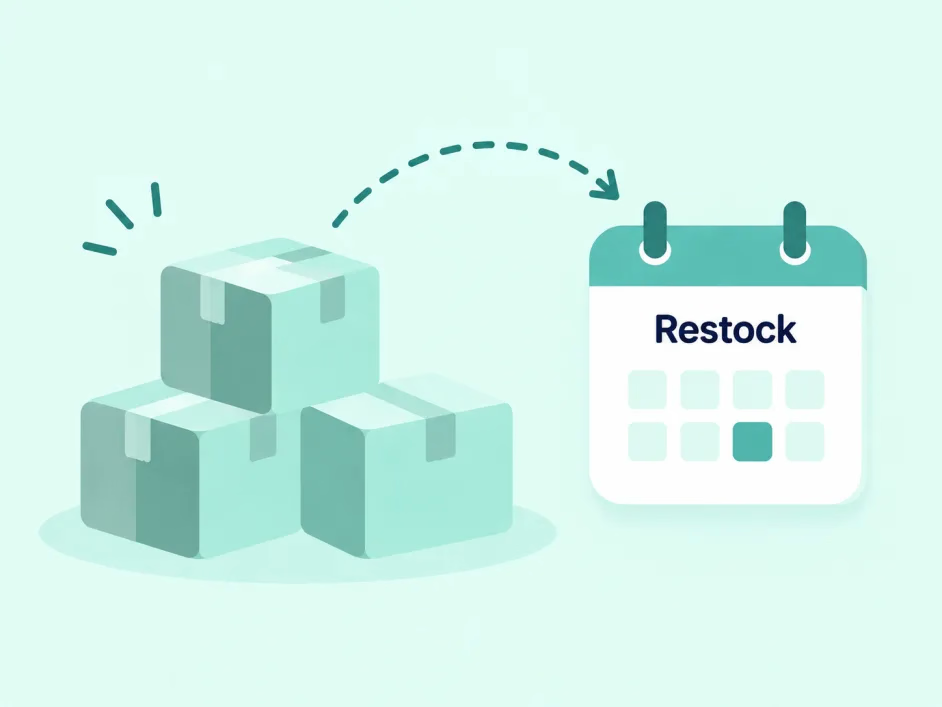
Review stock coverage and replenishment timing before driving demand.
Use historical sales to see trends, spikes and seasonal peaks by product.
Compare days of cover with your lead time and restock recommendations.
Time promotions and ad pushes for when stock can support them.
Connect once. Sales, fees, refunds and inventory come in without manual exports.
Filter by category, group by parent ASIN, and move from account totals to a single SKU.
Export your data to check the math or share it. Sales overview and ads-and-sales combined reports are available.
Data is kept from the day you connect, beyond Amazon’s 60-day reporting window.
Get notified when a listing may have been hijacked.
See how account data is accessed and stored in our privacy policy and GDPR pages.
Link your Amazon account to SellerApp.
While your data imports, add your product costs and shipping time.
Start with your account overview, then explore an individual product.
SellerApp’s PPC experts helped grow my Amazon presence and improve profitability by 20% in just two months. Great support and a strong choice for PPC management and listing optimization.
Result from SellerApp’s PPC management and listing optimization services, not the Profit Dashboard alone.




Profit starts with your sales and subtracts Amazon fees, storage, advertising, refunds and the cost of goods you enter. Margin, ROI and TACOS are calculated at account and ASIN level. The dashboard shows the definition for each metric.
Cost of goods per unit and shipping time. Amazon fees, storage, refunds and advertising spend are imported. Business overheads that Amazon doesn’t report aren’t included.
Yes. You can move from account totals to individual ASINs and SKUs, filter by category and group by parent ASIN.
Refunds appear as an amount, a percentage and a distribution by customer-selected reason for each ASIN. Advertising spend is shown per product and as TACOS, your total advertising cost as a share of sales.
It depends on the size of your account. Under typical conditions the first import takes around 12–24 hours.
14 Amazon marketplaces: US, UK, Canada, UAE, India, Australia, Japan, Mexico, Germany, Italy, France, Spain, Netherlands and Saudi Arabia.
Yes. Dashboard data can be downloaded, so you can check the numbers or share them with your team.
Features, marketplaces and account limits vary by plan. Connected products such as Advertising and Business Alerts are separate. See pricing or ask our team.
See how SellerApp connects product performance, costs, and inventory in one workflow.